

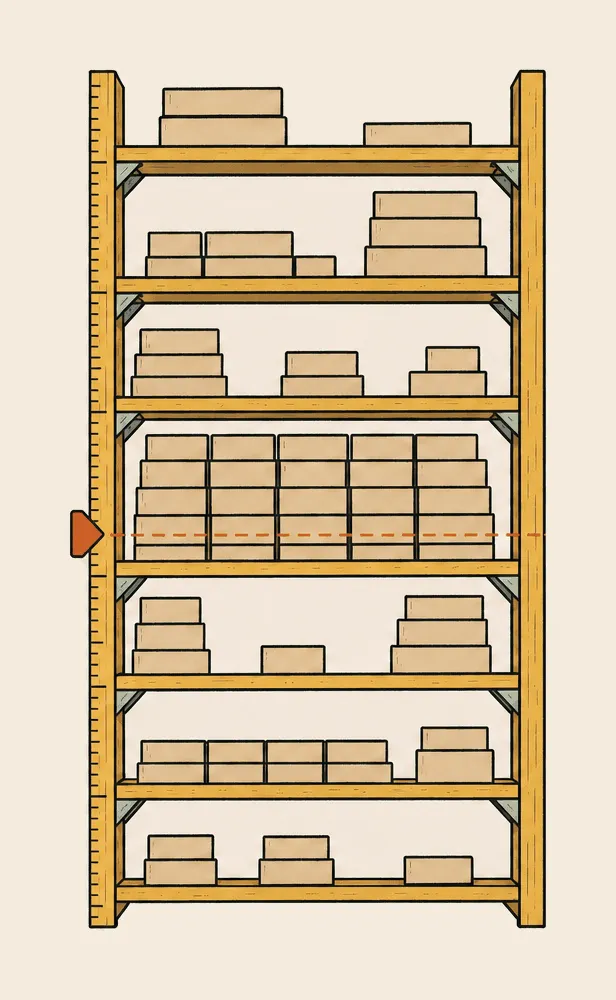
Say you bought bitcoin at $84,000. Then it fell, and you waited. Now it’s back near $82,000 and you’re almost even. What do you do?
A lot of people in that spot sell. Not because they’ve given up on bitcoin, but because getting out even feels like a win after weeks in the red. If enough of them bought at the same price, the price gets stuck right there.
That’s why traders care where other people bought. Most of them guess, by drawing lines on a chart. With bitcoin you don’t have to guess. Every coin on the chain carries the price it last moved at. Add them up and you get a map of what holders paid.
Big investors read the market this way too. Fidelity Digital Assets rates bitcoin on a cost-basis ratio in its quarterly Signals Report, and ARK Invest builds its bitcoin valuation framework on the same idea. One line gets the most attention: what recent buyers paid. Bitcoin spent most of the summer below it. Now it’s back above. Recent buyers are in profit again, and the question is where the next sellers are waiting.
The full map isn’t something you can pull from a free API. So we asked an agent to build it.
What the agent did
Where did bitcoin holders buy, and which prices matter right now? Use free data where you can.
- Pulled price and the average cost of all bitcoin: free
- Free data stops at the overall average
- Bought three on-chain metrics on TaskFuel: $0.05 each
Bitcoin is around $81,700. Recent buyers paid about $74,700 on average, so most of them are in profit. The biggest pile of bitcoin near today's price last moved between $82,000 and $86,000. Above that, the map shows no other point where major selling pressure is likely.
Paid from your TaskFuel balance · $0.15
All numbers below are from 22 October 2026.
Step one: the average, for free
The agent started with a free on-chain data API. It gives the price and a ratio called MVRV, which compares what all bitcoin is worth today with what it cost when it last moved. Divide the price by that ratio and you get the average cost of every bitcoin in existence: about $54,000.
That’s useful, but it lumps everyone together. Someone who bought in 2017 and someone who bought last month end up in the same number. To split them, the agent asked the same free API for the next layer of data, and it said no: the metric “is not available with supplied credentials”.
Step two: new holders against old ones
This is where the agent paid. The paid data sorts bitcoin into two groups. Coins that moved in the last 155 days, about five months, belong to short-term holders. Everything that hasn’t moved for longer belongs to long-term holders.
Short-term holders paid about $74,700 on average, so today they’re roughly 9% up. Long-term holders paid far less and are deep in profit.
The first number is the one traders watch. When the price is above what recent buyers paid, most of them are in profit and tend to hold. When it drops below, they’re all losing at once, and the selling can feed on itself. Right now the price is above that line.
Step three: the map
The last call is the map itself. It splits prices into small slices and counts how much bitcoin last moved in each one. It’s called URPD, short for UTXO Realized Price Distribution. Two things stand out.
Show the numbers
| Last moved between | Bitcoin | Share of all bitcoin |
|---|---|---|
| Below $40,391 | 7,759,837 BTC | 38.6% |
| $40,000 to $50,000 | 587,125 BTC | 2.9% |
| $50,000 to $60,000 | 644,173 BTC | 3.2% |
| $60,000 to $70,000 | 2,496,529 BTC | 12.4% |
| $70,000 to $80,000 | 1,595,004 BTC | 7.9% |
| $80,000 to $90,000 | 3,192,369 BTC | 15.9% |
| $90,000 to $100,000 | 1,329,621 BTC | 6.6% |
| $100,000 to $110,000 | 1,220,488 BTC | 6.1% |
| $110,000 to $120,000 | 1,123,473 BTC | 5.6% |
| $120,000 to $126,223 | 152,588 BTC | 0.8% |
Our $84,000 buyer has a lot of company. Nearly 10% of all bitcoin last moved between $82,000 and $86,000, right around today’s price. Many of those holders are close to even. That’s the pile traders expect to get in the way: as the price climbs through it, everyone who wanted out at even gets their chance.
Above the pile, there’s no second wall. From $86,000 up to about $118,000 the map spreads out in smaller piles, one after another. Each step up brings another group of holders back to even, but none as big as the one at today’s price. From that angle, the map shows no other point where major selling pressure is likely.
One caution. The map shows where coins last moved, not who bought them. An exchange shuffling coins between its own wallets resets the price too. Use the map as an indicator of price points for supply. It’s a snapshot, not investment advice.
When TaskFuel is worth it
Your agent can get the average on its own. A free API is enough for step one, and if one number is all you need, use it.
Steps two and three are where free stops. We found no free API for what short-term and long-term holders paid, or for the map. Some sites draw them as charts, which your agent can look at but not pull numbers from. The company behind this data sells its full API only on its top subscription tier, and its cheaper plan gets a more limited version. Through TaskFuel each metric is $0.05, paid per call.
By hand, you’d open the three charts on a paid charting site that includes them, copy the latest values, divide the price by each ratio, and add up the slices yourself.
The whole run cost $0.15, and the data came back in seconds.
Ask again when the price gets there
The map changes slowly. The price doesn’t. Ask again when bitcoin reaches one of these piles, and see who’s about to break even.
The bitcoin market data page lists what else the catalog covers. Connect your agent and the first $1 is on us.
Where did bitcoin holders buy, and which price levels matter right now? Get the price and the average cost of all bitcoin from free sources first. Use TaskFuel for what short-term and long-term holders paid and for the URPD, then tell me where the biggest piles of bitcoin are above and below today’s price.